Recent reports from a variety of sources analyze giving data for 2020 and 2021 from several different datasets and points of view. The major takeaway for Woodrow Rosenbaum, Chief Data Officer for Giving Tuesday, shared during a recent webinar covering several 2021 giving reports, was: “We’re back to a multi-year trend we saw prior to 2020, which is more of the dollars coming from fewer donors. This is not a healthy trend in the nonprofit sector…we essentially lost the gains of 2020” in terms of number of donors (although overall dollars are up, partly because of megadonors). More donors means a “broader base of support,” which “correlates with better resilience for organizations,” according to Rosenbaum.
Everyone knows how vital charitable giving is to the entire charitable nonprofit community and those we all serve. It is indispensable. Yet it’s important to keep in mind that it’s not the only source of revenue, or even the main one.
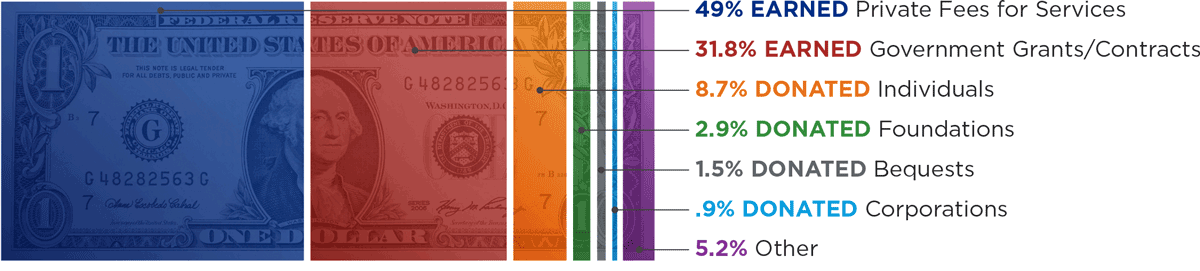
While the precise data in the graph are somewhat dated, the image demonstrates this general point that is still valid: the nonprofit sector as a whole earns roughly half of all revenues from payment for services, and earns nearly a third of total revenue by performing government grants/contracts. The sector also receives about 14 percent of its total revenue through charitable giving from all sources – individuals, foundations, bequests, and corporations. (These data apply to the sector as a whole; every nonprofit has different business models with various revenue streams and amounts.)
Every dollar matters. With inflation eating away 8.6 percent of buying power and government grants/contracts not paying the full costs – and capping how much will be reimbursed based on fixed formulas – it puts tremendous pressure on nonprofits and donors.
Giving USA 2022: The Annual Report on Philanthropy for the Year 2021 estimates that individuals, bequests, foundations, and corporations gave almost $485 billion to U.S. charities in 2021. While it appears that total charitable giving grew 4 percent in 2021 compared with 2020, in reality, total giving was actually down after adjusting for inflation. Still, it was above pre-pandemic levels. Giving to arts and cultural organizations rebounded, but giving to human services, education, and international affairs fell after adjusting for inflation. Giving by individuals reached nearly $327 billion in 2021, due in part to megagifts (gifts of $450 million or more) from a few individuals to a few institutions. However, it’s important to recognize that the $327 billion given by individuals does not mean $327 billion was received by nonprofits delivering services to the public in 2021; nearly 20 percent was given to foundations. On the bright side, donors acquired in 2020 renewed their giving at very high rates in 2021 compared with previous years. The full Giving USA 2022: The Annual Report on Philanthropy for the Year 2021 will be available for purchase and download in mid-July.
IRS Charitable Giving Data for 2020 Released: The Internal Revenue Service published its 2020 data on charitable giving and other aspects of individual taxes. The CARES Act of 2020 included a temporary universal charitable deduction (UCD), enabling people who don’t itemize their taxes to claim a deduction for donations to charitable nonprofits. With the release of the new IRS data, the true positive impact of the charitable giving incentive is undeniable.
- In 2020, most individual tax returns (87.5 percent) claimed a standard deduction (did not itemize).
- 42.2 million taxpayers (29.4 percent of all individual tax returns) used the universal charitable deduction, which expired at the end of last year. These taxpayers made a total of $10.9 billion in contributions to charitable nonprofits in 2020.
- Nearly a quarter of the donors taking this non-itemizer deduction had adjusted gross income of less than $30,000. The largest segment of taxpayers to take advantage of the UCD were those earning between $50,000 and $100,000.
- The new data are important in understanding the impact of 2017 tax reforms, when Congress doubled the standard deduction and asserted that lower tax rates would generate greater charitable giving. A recent American Enterprise Institute analysis found that contrary to these claims, the 2017 tax law did not result in upper-income taxpayers donating more to the work of charitable organizations as promised; in fact, charitable giving went down after its enactment.
The IRS data highlight why Congress needs to restore – and improve – the universal charitable deduction. The National Council of Nonprofits and others continue to advocate in support of bipartisan legislation that’s been introduced to do just that. The charitable giving incentive existed for 100 years, from 1917 until it was taken away from ordinary Americans who don’t itemize their deductions in 2017, while wealthier individuals could continue to do so. Reinstating the universal charitable deduction would provide low- and moderate-income taxpayers incentives to support their local communities by giving to charitable nonprofits and counter the growing problem of a shrinking pool donors.
Fundraising Effectiveness Project Underscores Effectiveness of Universal Charitable Deduction. In last month’s newsletter, we summarized the Fundraising Effectiveness Project’s 2021 giving report. Our colleagues at the Charitable Giving Coalition posted an article analyzing an additional aspect of the new data, providing further evidence that the universal charitable deduction works. “When measuring donations of $300 – the amount of the temporary universal charitable deduction for individuals – FEP found increases in both 2020 and 2021. When compared to 2019 gifts of $300, FEP found a 7.5 percent increase in 2020 and 2021. Furthermore, they also measured gifts of $300 made on the last day of the year, which is when we see the most giving compared to the rest of the year. Numbers show a 33 percent increase of those $300 gifts on December 31, 2020, when compared to 2019, and a 7 percent increase on December 31, 2021, when compared to 2019.” Obviously, the incentive is effective.
Nonprofit Finance Fund Survey: Two weeks ago, the Nonprofit Finance Fund (NFF) released the results from its 2022 State of the Nonprofit Sector Survey (and thank you to those readers who filled out the survey). Among other things, the survey found that 79 percent of nonprofits experienced an increase in demand for their services in 2021 and that 51 percent of nonprofits were unable to meet demands for their services. While the survey found that more than two-thirds of responding nonprofits saw overall funding increase during the worst of the pandemic, there are a few important caveats. First, participation in this year’s survey was not as robust as in past years. In addition, larger organizations and nonprofits in the L.A. area were overrepresented among responding nonprofits.
Neon One’s new data hub shares some insights about where, when, and how donations in a Neon One dataset were made. View by time of day, state, NTEE classification, and donation type, with additional interactive data on December giving for 2019 and 2020.