State legislative elections, 2016
| 2016 State Legislative Elections | |
|---|---|
2017 »
« 2015
| |
| Part 1: Overview | |
| Part 2: Battlegrounds | |
| Part 3: Competitiveness | |
| Impact of term limits | |
| Part 4: Elections by state | |
| Election dates | |
| 2016 Elections | |
|---|---|
| Choose a chamber below: | |
On November 8, 2016, 86 of America's 99 state legislative chambers held elections. Both Democrats and Republicans made gains in different areas of the country. Overall, the GOP gained came out ahead. Republicans flipped 138 seats while Democrats flipped 95 seats. The Republican Party's share of seats in state legislatures increased by 43 seats across the country. Republicans controlled 4,161 (56.4 percent) of the 7,383 legislative seats heading into the election.
In 2010 and 2014, Republicans won hundreds of formerly Democratic-held state legislative seats across the United States. These past successes put them at a relatively greater partisan risk in 2016, since the GOP held a higher percentage of the seats up for election than Democrats. However, Republicans were able to maintain and increase their advantage in state legislative chambers nationwide. The Democratic Party would need to oust Republican majorities in many state legislative chambers over the course of 2018 and 2020 in order to control the redistricting process in 2020. This process establishes congressional and legislative district lines in many states, which can influence the competitiveness of those elections in favor of one political party or another until the following census in 2030.
Seven chambers flipped control as a result of the election. Republicans gained majorities in the Iowa State Senate, Kentucky House of Representatives, and Minnesota State Senate. The GOP gained two additional trifectas as a result of Iowa and Kentucky. Democrats were able to flip the Nevada State Senate, Nevada State Assembly, and New Mexico House of Representatives. As a result, a Republican trifecta was broken in Nevada. Changes on November 8 brought the Republican Party's control of all three aspects of state government to 25 states. Democrats' share of trifectas dropped to six states.[1]
In the aftermath of the 2016 elections, 68 chambers were under GOP control, while Democrats held majorities in 31 chambers.[2] In 43 of the 50 state senates, 1,212 seats were up for election. In 43 of the 49 state houses, 4,711 of the country's 5,411 state house seats were up for election.
Two chambers moved to a split balance following the election:
- Republicans in the Connecticut State Senate picked up three seats, moving the balance of the chamber to 18-18.
- The Delaware State Senate resulted in a temporary split after state Sen. Bethany Hall-Long (D) won election in the lieutenant governor's race. A special election to fill the vacancy left by Hall-Long took place on February 25, 2017. The race for Hall-Long's District 10 seat in 2014 was competitive, with a 2.2 percent margin of victory. Read more about the special election on February 25, 2017, here.
Three states entered into unique governing situations in their state legislative chambers after the 2016 elections:
- Alaska Republicans were able to maintain a numerical majority in the state House despite losing two seats. Shortly after the election, a coalition was announced between House Democrats, three Republican representatives, and two independent representatives. The coalition gave effective control of the chamber to Democrats.
- The Independent Democratic Caucus of the New York State Senate, along with an additional Democratic state senator, once again gave Republicans control of the state Senate despite Democrats winning a numerical majority.
- Democrats gained a numerical majority in the Washington State Senate. However, Republicans maintained control of the chamber due to a Democratic senator who caucuses with the Republicans.
What was at stake
Partisan balance
There was little shift in the number of chambers controlled by either party. The Democratic Party and Republican Party each lost three chambers to the other party on election night. However, Democrats also lost majorities in the Connecticut State Senate and Delaware State Senate when those chambers moved to a split partisan balance. A special election will determine which party controls the 21-member Delaware Senate. In Alaska, coalition between House Democrats, three Republican representatives, and two independent representatives gave effective control of the chamber to Democrats.
Heading into the 2016 elections, Republicans held a majority of state legislative chambers. Sixty-nine chambers were under GOP control, while Democrats held majorities in 30 chambers.[3]
The following table details partisan balance in all 99 chambers.
| Partisan Control of All 99 State Legislatures | |||||
|---|---|---|---|---|---|
| Pre-election | Post-election | ||||
| Legislative Chamber | |||||
| State senates | 14 | 36 | 13 | 37 | |
| State houses | 16 | 33 | 18 | 31 | |
| Total: | 30 | 69 | 31 | 68 | |
The following table details partisan balance of all 7,383 state legislative seats.[4]
| Partisan Balance of All 7,383 State Legislative Seats | ||||||||
|---|---|---|---|---|---|---|---|---|
| Pre-election | Post-election | |||||||
| Legislative Chamber | ||||||||
| State senates | 839 | 1,125 | 8 | 804 | 1,158 | 10 | ||
| State houses | 2,347 | 3,036 | 28 | 2,339 | 3,047 | 25 | ||
| Total: | 3,186 | 4,161 | 36 | 3,143 | 4,205 | 35 | ||
Chambers that flipped in 2016
Seven chambers flipped control after the November 2016 elections.
| State | Pre-election party in power | Post-election party in power |
|---|---|---|
| Iowa State Senate | ||
| Kentucky House of Representatives | ||
| Minnesota State Senate | ||
| Nevada State Senate | ||
| Nevada State Assembly | ||
| New Mexico House of Representatives | ||
| Alaska House of Representatives[6] |
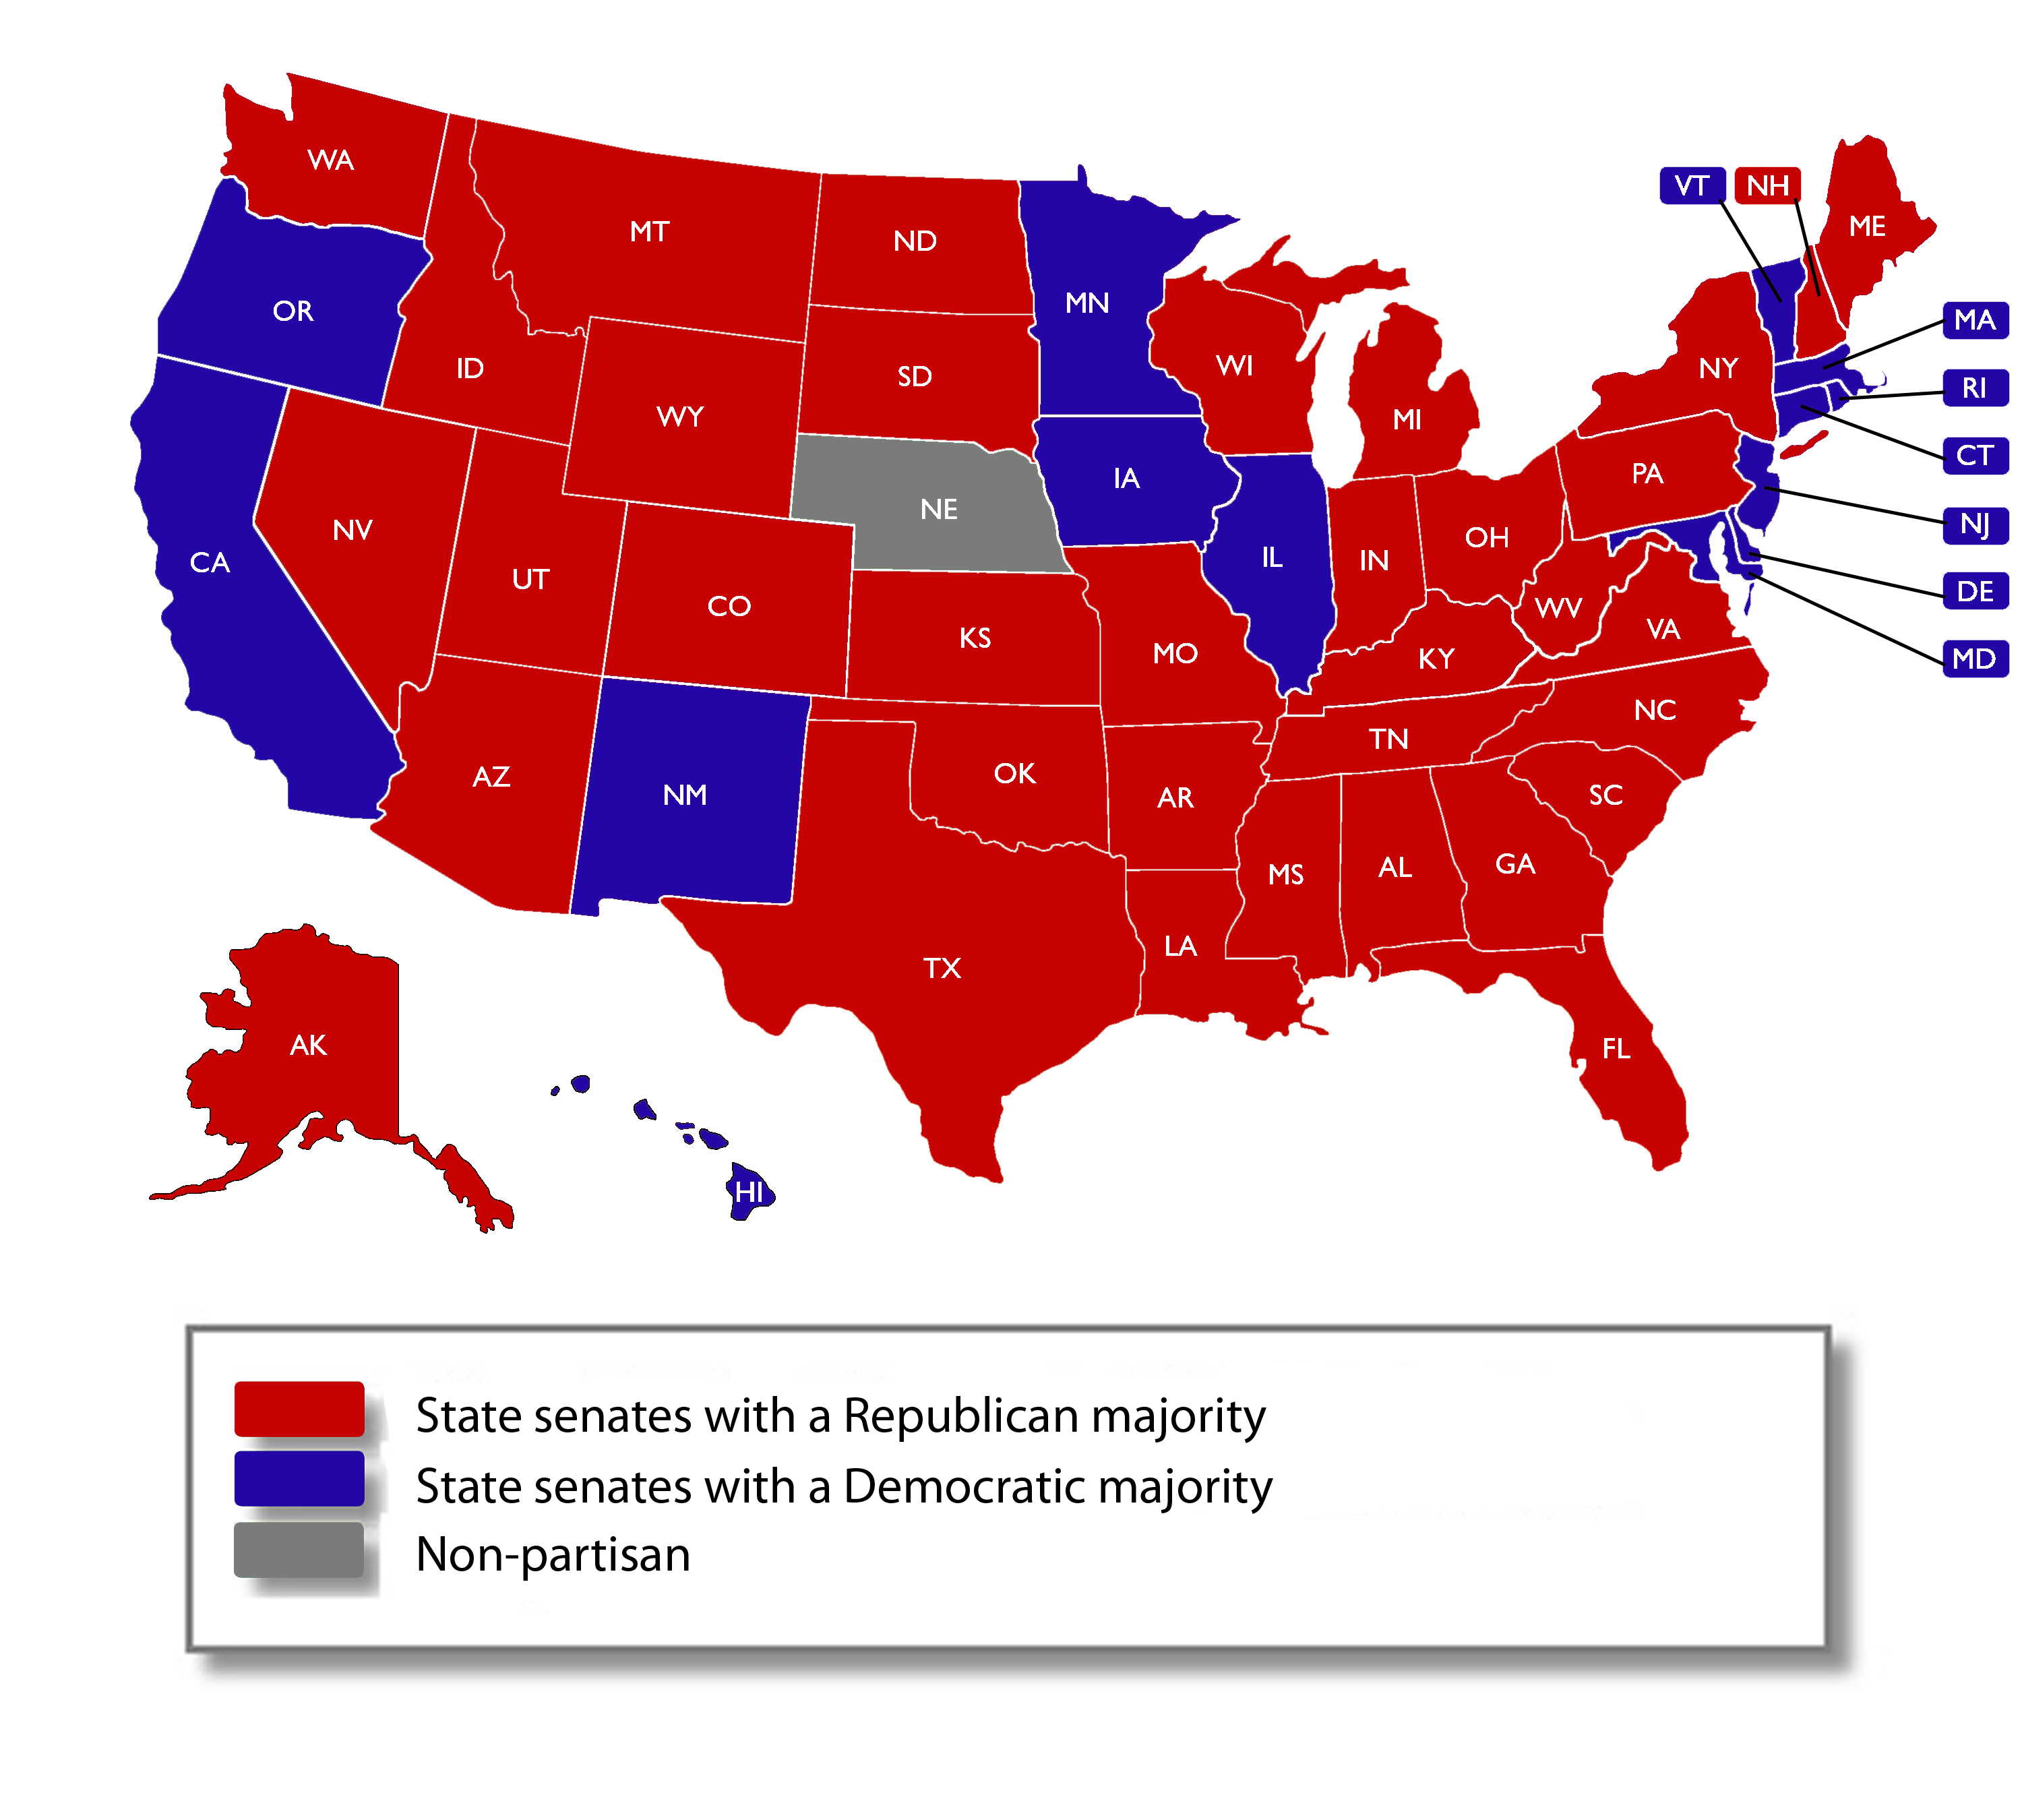
Pre-election partisan balance
- Figure 1: Partisan control of state senate chambers prior to the 2016 election. Democrats controlled 14 state senates and Republicans controlled 36 state senates.[7]
- Figure 2: Partisan control of state house chambers prior to the 2016 election. Democrats controlled 16 state houses and Republicans controlled 33 state houses.

State legislatures during the Obama presidency
Since World War II, the political party of an outgoing two-term president or consecutive political party administration has lost an average of 450 state legislative seats, excluding President Barack Obama. During President Obama's (D) two terms in office, Democrats experienced a net loss of 968 state legislative seats, the largest net loss of state legislative seats in this category since World War II. The second-largest loss occurred following Dwight D. Eisenhower's two terms in office, when Republicans were handed a net loss of 843 state legislative seats. President Ronald Reagan (R) was the only president to increase his party's number of state legislative seats over his two terms in office, gaining six total seats across all 50 state legislatures.[8]
Click here to read more about changes in state legislative seats during the Obama presidency »
State government trifectas
A trifecta is when one political party holds these three positions in a state's government:
- The governorship
- A majority in the state senate
- A majority in the state house
The concept of the trifecta is important in state lawmaking because in many states, the governor, senate majority leader, and house majority leader play decisive roles in the legislative process.
Heading into the 2016 elections, 30 states were controlled by a trifecta. Only Alaska, Colorado, Illinois, Iowa, Kentucky, Louisiana, Maine, Maryland, Massachusetts, Minnesota, Missouri, Montana, New Hampshire, New Jersey, New Mexico, New York, Pennsylvania, Virginia, Washington, and West Virginia had split party control of their governments. Nebraska is a unique case in that the Governor of Nebraska was a Republican and the legislature, although technically nonpartisan, was controlled by a Republican majority.
Heading into the election, states with a trifecta included:
 7 Democratic trifectas
 23 Republican trifectas
As a result of the November 2016 elections, there were 31 state government trifectas in the 2017 state legislative sessions.
- 6 Democratic trifectas[9]
- 25 Republican trifectas
Battleground chambers
Of the 86 chambers with elections in 2016, Ballotpedia identified the top 20 state legislative chambers to watch. These are the chambers where one party might have, realistically, toppled the other party from its position of majority control.
Chambers targeted by the DLCC and RSLC
The Democratic Legislative Campaign Committee and Republican State Leadership Committee publicly targeted chambers in 20 states.
The DLCC and RSLC also released lists of legislative seats that would be instrumental in their attempts to flip or defend target chambers. Democrats released three publications of their "Essential Races" list while the GOP published three rounds of their "16 in '16: Races to Watch."
The five districts that were targeted by both the DLCC and RSLC were:
- A Democratic candidate and a Republican candidate competed for the open seat in a swing district.
- A Democrat and a Republican ran for this open seat left by the Democratic incumbent.
- The Democratic incumbent faced a Republican opponent.
- Republicans and Democrats competed for an open seat left by the Democratic incumbent.
- A Democrat fought to keep an open seat in a competitive district most recently held by a Democrat.
The following table details each district targeted by the DLCC and RSLC. Click [Show] to expand the table. Party targeting details which organization included the district in their list. Type details if the intent by the DLCC or RSLC was to flip the district or prevent the other party from flipping it.
| 2016 Legislature Target Districts | |||||||||||
|---|---|---|---|---|---|---|---|---|---|---|---|
| State | Chamber | District | Party targeting | Pre-2016 control | Type | 2016 Result | |||||
| Alaska | State House | 21 | RSLC | Offensive | |||||||
| Arizona | State House | 2 | DLCC | Offensive[10] | |||||||
| Arizona | State Senate | 2 | RSLC | Offensive | |||||||
| Arizona | State Senate | 13 | RSLC | Offensive | |||||||
| Arizona | State Senate | 28 | Both | Both | |||||||
| California | State Senate | 29 | RSLC | Defensive | |||||||
| California | State Assembly | 38 | RSLC | Defensive | |||||||
| Colorado | State House | 3 | Both | Both | |||||||
| Colorado | State Senate | 19 | DLCC | Offensive | |||||||
| Colorado | State Senate | 26 | RSLC | Offensive | |||||||
| Colorado | State House | 30 | DLCC | Offensive | |||||||
| Colorado | State House | 31 | RSLC | Offensive | |||||||
| Connecticut | State Senate | 17 | RSLC | Offensive | |||||||
| Connecticut | State House | 110 | RSLC | Offensive | |||||||
| Florida | State Senate | 37 | DLCC | Offensive | |||||||
| Florida | State House | 47 | DLCC | Offensive | |||||||
| Florida | State House | 69 | DLCC | Offensive | |||||||
| Florida | State House | 112 | RSLC | Offensive | |||||||
| Florida | State House | 114 | RSLC | Defensive | |||||||
| Georgia | State House | 81 | DLCC | Defensive | |||||||
| Georgia | State House | 96 | DLCC | Defensive | |||||||
| Hawaii | State House | 34 | RSLC | Offensive | |||||||
| Illinois | State House | 71 | RSLC | Offensive | |||||||
| Iowa | State Senate | 28 | DLCC | Offensive | |||||||
| Iowa | State Senate | 30 | RSLC | Offensive | |||||||
| Iowa | State Senate | 34 | RSLC | Offensive | |||||||
| Iowa | State Senate | 46 | DLCC | Defensive | |||||||
| Iowa | State House | 55 | DLCC | Offensive | |||||||
| Kentucky | State House | 3 | RSLC | Offensive | |||||||
| Kentucky | State House | 8 | DLCC | Defensive | |||||||
| Kentucky | State House | 20 | RSLC | Offensive | |||||||
| Kentucky | State House | 38 | DLCC | Offensive | |||||||
| Kentucky | State House | 46 | DLCC | Defensive | |||||||
| Kentucky | State House | 99 | RSLC | Offensive | |||||||
| Maine | State Senate | 6 | RSLC | Defensive | |||||||
| Michigan | State House | 71 | DLCC | Offensive | |||||||
| Michigan | State House | 83 | RSLC | Defensive | |||||||
| Michigan | State House | 91 | DLCC | Offensive | |||||||
| Michigan | State House | 99 | DLCC | Offensive | |||||||
| Michigan | State House | 106 | RSLC | Defensive | |||||||
| Minnesota | State Senate | 1 | DLCC | Defensive | |||||||
| Minnesota | State Senate | 53 | RSLC | Offensive | |||||||
| Minnesota | State Senate | 58 | DLCC | Offensive | |||||||
| Minnesota | State House | 28B | DLCC | Offensive | |||||||
| Minnesota | State House | 42B | RSLC | Offensive | |||||||
| Missouri | State Senate | 1 | DLCC | Defensive | |||||||
| Missouri | State Senate | 19 | DLCC | Offensive | |||||||
| Montana | State House | 3 | DLCC | Defensive | |||||||
| Montana | State House | 25 | DLCC | Defensive | |||||||
| Montana | State Senate | 26 | DLCC | Offensive | |||||||
| Nevada | State Senate | 15 | DLCC | Offensive | |||||||
| Nevada | State Assembly | 25 | RSLC | Defensive | |||||||
| New Hampshire | State Senate | 12 | DLCC | Offensive | |||||||
| New Hampshire | State Senate | 23 | DLCC | Offensive | |||||||
| New Mexico | State House | 4 | DLCC | Offensive | |||||||
| New Mexico | State Senate | 9 | RSLC | Offensive | |||||||
| New Mexico | State House | 15 | DLCC | Offensive | |||||||
| New Mexico | State House | 24 | RSLC | Defensive | |||||||
| New Mexico | State Senate | 29 | Both | Both | |||||||
| New Mexico | State House | 30 | DLCC | Offensive | |||||||
| New Mexico | State House | 32 | RSLC | Offensive | |||||||
| New Mexico | State House | 43 | RSLC | Offensive | |||||||
| New York | State Senate | 6 | DLCC | Offensive | |||||||
| New York | State Senate | 7 | DLCC | Offensive | |||||||
| North Carolina | State House | 98 | DLCC | Offensive | |||||||
| North Dakota | State House | 44 | DLCC | Offensive[10] | |||||||
| Ohio | State House | 16 | DLCC | Offensive | |||||||
| Ohio | State Senate | 24 | DLCC | Offensive | |||||||
| Ohio | State House | 95 | DLCC | Offensive | |||||||
| Oklahoma | State House | 39 | RSLC | Defensive | |||||||
| Oregon | State Senate | 3 | DLCC | Defensive | |||||||
| Oregon | State House | 20 | RSLC | Offensive | |||||||
| Oregon | State House | 22 | RSLC | Offensive | |||||||
| Oregon | State Senate | 25 | RSLC | Offensive | |||||||
| Oregon | State House | 51 | Both | Both | |||||||
| South Dakota | State House | 27 | DLCC | Defensive | |||||||
| Texas | State House | 118 | RSLC | Defensive | |||||||
| Washington | State Senate | 17 | RSLC | Defensive | |||||||
| Washington | State Senate | 28 | DLCC | Offensive | |||||||
| Washington | State House | 30a | DLCC | Offensive | |||||||
| Washington | State House | 44A | RSLC | Offensive | |||||||
| Washington | State House | 45A | RSLC | Offensive | |||||||
| West Virginia | State Senate | 16 | Both | Both | |||||||
| West Virginia | State House | 38 | RSLC | Defensive | |||||||
| Wisconsin | State Senate | 14 | DLCC | Offensive | |||||||
| Wisconsin | State Senate | 18 | DLCC | Offensive | |||||||
| Wisconsin | State Assembly | 51 | DLCC | Offensive | |||||||
| Wisconsin | State Assembly | 85 | DLCC | Offensive | |||||||
| Wisconsin | State Assembly | 94 | RSLC | Offensive | |||||||
| Wyoming | State Senate | 10 | DLCC | Offensive | |||||||
The following table details recent election history for each targeted district. Click [Show] to expand the table. Included is the vote share each 2012 presidential candidate received for the state and for the legislative district. Vote shares for 2014 and 2012 legislative candidates are also included.
| 2016 Legislature Target Districts, Election History | |||||||||||
|---|---|---|---|---|---|---|---|---|---|---|---|
| State | Chamber | District | Party targeting | Obama % (State) | Romney % (State) | Obama % (District) | Romney % (District) | 2014 D | 2014 R | 2012 D | 2012 R |
| Alaska | State House | 21 | RSLC | 41% | 55% | 50% | 47% | 51% | 49% | 37% | 63% |
| Arizona | State House | 2 | DLCC | 44% | 54% | 57% | 42% | 37% | 34% | 34% | 30% |
| Arizona | State Senate | 2 | RSLC | 44% | 54% | 57% | 42% | 55% | 45% | 97% | 3% |
| Arizona | State Senate | 13 | RSLC | 44% | 54% | 34% | 65% | 36% | 64% | 0% | 100% |
| Arizona | State Senate | 28 | Both | 44% | 54% | 45% | 54% | 43% | 53% | 44% | 56% |
| California | State Senate | 29 | RSLC | 59% | 38% | 49% | 49% | No election | No election | 45% | 55% |
| California | State Assembly | 38 | RSLC | 59% | 38% | 47% | 51% | 34% | 66% | 43% | 57% |
| Colorado | State House | 3 | Both | 51% | 47% | 52% | 45% | 51% | 49% | 51% | 45% |
| Colorado | State Senate | 19 | DLCC | 51% | 47% | 52% | 45% | 47% | 48% | 47% | 46% |
| Colorado | State Senate | 26 | RSLC | 51% | 47% | 53% | 44% | No election | No election | 54% | 46% |
| Colorado | State House | 30 | DLCC | 51% | 47% | 58% | 40% | 50% | 50% | 55% | 40% |
| Colorado | State House | 31 | RSLC | 51% | 47% | 58% | 40% | 50% | 50% | 60% | 40% |
| Connecticut | State Senate | 17 | RSLC | 58% | 40% | 60% | 39% | 51% | 42% | 71% | 29% |
| Connecticut | State House | 110 | RSLC | 58% | 40% | 70% | 29% | 64% | 30% | 73% | 27% |
| Florida | State Senate | 37 | DLCC | 50% | 49% | 50% | 50% | No election | No election | 0% | 100% |
| Florida | State House | 47 | DLCC | 50% | 49% | 50% | 49% | 48% | 52% | 52% | 48% |
| Florida | State House | 69 | DLCC | 50% | 49% | 51% | 48% | 42% | 58% | 48% | 52% |
| Florida | State House | 112 | RSLC | 50% | 49% | 54% | 46% | 51% | 49% | 54% | 46% |
| Florida | State House | 114 | RSLC | 50% | 49% | 50% | 49% | 44% | 53% | 49% | 51% |
| Georgia | State House | 81 | DLCC | 45% | 53% | 52% | 46% | 53% | 47% | 56% | 44% |
| Georgia | State House | 96 | DLCC | 45% | 53% | 57% | 42% | 100% | -- | 55% | 45% |
| Hawaii | State House | 34 | RSLC | 71% | 28% | 73% | 26% | 61% | 39% | 100% | -- |
| Illinois | State House | 71 | RSLC | 57% | 41% | 57% | 42% | 50% | 50% | 52% | 48% |
| Iowa | State Senate | 28 | DLCC | 52% | 46% | 54% | 45% | No election | No election | 50% | 50% |
| Iowa | State Senate | 30 | RSLC | 52% | 46% | 53% | 46% | No election | No election | 51% | 49% |
| Iowa | State Senate | 34 | RSLC | 52% | 46% | 52% | 47% | No election | No election | 61% | 39% |
| Iowa | State Senate | 46 | DLCC | 52% | 46% | 56% | 43% | No election | No election | 53% | 47% |
| Iowa | State House | 55 | DLCC | 52% | 46% | 55% | 43% | 50% | 50% | 51% | 49% |
| Kentucky | State House | 3 | RSLC | 61% | 38% | 41% | 58% | 54% | 46% | 59% | 41% |
| Kentucky | State House | 8 | DLCC | 61% | 38% | 45% | 54% | 100% | -- | 66% | 34% |
| Kentucky | State House | 20 | RSLC | 61% | 38% | 48% | 50% | 63% | 37% | 61% | 39% |
| Kentucky | State House | 38 | DLCC | 61% | 38% | 54% | 44% | 100% | -- | 59% | 41% |
| Kentucky | State House | 46 | DLCC | 61% | 38% | 54% | 44% | 65% | 35% | 64% | 36% |
| Kentucky | State House | 99 | RSLC | 61% | 38% | 40% | 57% | 100% | -- | 100% | -- |
| Maine | State Senate | 6 | RSLC | 56% | 41% | 50% | 48% | 45% | 55% | 55% | 45% |
| Michigan | State House | 71 | DLCC | 54% | 45% | 52% | 47% | 50% | 50% | 53% | 47% |
| Michigan | State House | 83 | RSLC | 54% | 45% | 46% | 53% | 38% | 62% | 44% | 56% |
| Michigan | State House | 91 | DLCC | 54% | 45% | 51% | 49% | 46% | 47% | 48% | 47% |
| Michigan | State House | 99 | DLCC | 54% | 45% | 51% | 48% | 48% | 52% | 43% | 57% |
| Michigan | State House | 106 | RSLC | 54% | 45% | 45% | 54% | 45% | 55% | 45% | 52% |
| Minnesota | State Senate | 1 | DLCC | 53% | 45% | 45% | 53% | No election | No election | 61% | 39% |
| Minnesota | State Senate | 53 | RSLC | 53% | 45% | 52% | 47% | No election | No election | 52% | 48% |
| Minnesota | State Senate | 58 | DLCC | 53% | 45% | 42% | 56% | No election | No election | 42% | 58% |
| Minnesota | State House | 28B | DLCC | 53% | 45% | 52% | 46% | 44% | 56% | 42% | 58% |
| Minnesota | State House | 42B | RSLC | 53% | 45% | 57% | 41% | 52% | 48% | 58% | 42% |
| Missouri | State Senate | 1 | DLCC | 44% | 54% | 51% | 48% | No election | No election | 51% | 49% |
| Missouri | State Senate | 19 | DLCC | 44% | 54% | 49% | 49% | No election | No election | 42% | 58% |
| Montana | State House | 3 | DLCC | 42% | 55% | 36% | 60% | 49% | 47% | 44% | 51% |
| Montana | State House | 25 | DLCC | 42% | 55% | 50% | 47% | 52% | 48% | 51% | 49% |
| Montana | State Senate | 26 | DLCC | 42% | 55% | 45% | 52% | No election | No election | 59% | 41% |
| Nevada | State Senate | 15 | DLCC | 52% | 46% | 51% | 47% | No election | No election | 50% | 50% |
| Nevada | State Assembly | 25 | RSLC | 52% | 46% | 46% | 52% | 0% | 75% | 0% | 100% |
| New Hampshire | State Senate | 12 | DLCC | 52% | 46% | 47% | 51% | 49% | 51% | 52% | 48% |
| New Hampshire | State Senate | 23 | DLCC | 52% | 46% | 48% | 51% | 43% | 57% | 47% | 53% |
| New Mexico | State House | 4 | DLCC | 53% | 43% | 52% | 45% | 40% | 60% | 39% | 61% |
| New Mexico | State Senate | 9 | RSLC | 53% | 43% | 51% | 45% | No election | No election | 50% | 50% |
| New Mexico | State House | 15 | DLCC | 53% | 43% | 50% | 45% | 48% | 52% | 51% | 49% |
| New Mexico | State House | 24 | RSLC | 53% | 43% | 52% | 42% | 48% | 52% | 51% | 49% |
| New Mexico | State Senate | 29 | Both | 53% | 43% | 53% | 42% | No election | No election | 55% | 45% |
| New Mexico | State House | 30 | DLCC | 53% | 43% | 50% | 44% | 46% | 54% | 46% | 54% |
| New Mexico | State House | 32 | RSLC | 53% | 43% | 49% | 48% | 53% | 47% | 64% | 36% |
| New Mexico | State House | 43 | RSLC | 53% | 43% | 52% | 43% | 57% | 43% | 51% | 49% |
| New York | State Senate | 6 | DLCC | 63% | 36% | 55% | 44% | 37% | 63% | 48% | 52% |
| New York | State Senate | 7 | DLCC | 63% | 36% | 54% | 45% | 43% | 57% | 48% | 52% |
| North Carolina | State House | 98 | DLCC | 48% | 51% | 43% | 56% | 45% | 55% | 0% | 100% |
| North Dakota | State House | 44 | DLCC | 59% | 39% | 52% | 45% | No election | No election | 26% | 26% |
| Ohio | State House | 16 | DLCC | 50% | 48% | 49% | 50% | 38% | 62% | 42% | 58% |
| Ohio | State Senate | 24 | DLCC | 50% | 48% | 48% | 51% | No election | No election | 41% | 59% |
| Ohio | State House | 95 | DLCC | 50% | 48% | 40% | 58% | 43% | 57% | 47% | 53% |
| Oklahoma | State House | 39 | RSLC | 67% | 33% | 28% | 73% | -- | 100% | -- | 100% |
| Oregon | State Senate | 3 | DLCC | 54% | 43% | 53% | 44% | 52% | 44% | -- | -- |
| Oregon | State House | 20 | RSLC | 54% | 43% | 51% | 47% | 52% | 48% | 37% | 63% |
| Oregon | State House | 22 | RSLC | 54% | 43% | 54% | 43% | 53% | 43% | 54% | 46% |
| Oregon | State Senate | 25 | RSLC | 54% | 43% | 56% | 42% | No election | No election | 34% | 64% |
| Oregon | State House | 51 | Both | 54% | 43% | 53% | 45% | 53% | 47% | 53% | 47% |
| South Dakota | State House | 27 | DLCC | 40% | 58% | 60% | 39% | 34% | 32% | 45% | 36% |
| Texas | State House | 118 | RSLC | 41% | 57% | 55% | 43% | 100% | -- | 60% | 40% |
| Washington | State Senate | 17 | RSLC | 56% | 42% | 48% | 49% | No election | No election | 50% | 50% |
| Washington | State Senate | 28 | DLCC | 56% | 42% | 54% | 43% | 46% | 54% | 42% | 58% |
| Washington | State House | 30a | DLCC | 56% | 42% | 59% | 39% | 43% | 57% | 49% | 51% |
| Washington | State House | 44A | RSLC | 56% | 42% | 54% | 44% | 52% | 48% | 54% | 46% |
| Washington | State House | 45A | RSLC | 56% | 42% | 58% | 40% | 55% | 45% | 56% | 44% |
| West Virginia | State Senate | 16 | Both | 36% | 62% | 46% | 52% | 52% | 48% | 54% | 46% |
| West Virginia | State House | 38 | RSLC | 36% | 62% | 34% | 65% | 0% | 100% | 36% | 64% |
| Wisconsin | State Senate | 14 | DLCC | 53% | 46% | 48% | 51% | No election | No election | 42% | 58% |
| Wisconsin | State Senate | 18 | DLCC | 53% | 46% | 49% | 50% | No election | No election | 50% | 50% |
| Wisconsin | State Assembly | 51 | DLCC | 53% | 46% | 59% | 40% | 47% | 48% | 48% | 52% |
| Wisconsin | State Assembly | 85 | DLCC | 53% | 46% | 52% | 47% | 50% | 50% | 50% | 47% |
| Wisconsin | State Assembly | 94 | RSLC | 53% | 46% | 52% | 47% | 54% | 46% | 61% | 39% |
| Wyoming | State Senate | 10 | DLCC | 28% | 69% | 42% | 54% | No election | No election | -- | 100% |
Electoral competitiveness
Every year, Ballotpedia uses official candidate lists from each state to examine the competitiveness of every state legislative race in the country.
Below is Ballotpedia's 2016 competitiveness analysis. Click here to read the full study »

Open seats — Is the incumbent running for re-election?
- When incumbents run, they enjoy significant advantages over their challenger. This is why, at all levels of politics, incumbents who are running for re-election defeat their challenger around 85 percent of the time.
- There was no incumbent running for re-election in 1,040 (17.6%) of the 5,923 seats up for election in 2016, either because he or she voluntarily chose not to run again, faced term limits, or was affected by redistricting. This is an increase from 17.0 percent in 2014.
- In 4,883 (82.4%) of the 5,923 seats up for election in 2016, the incumbent ran for re-election.
Read more about open seats here »
Incumbents in primaries: — If an incumbent does run for re-election, does he or she draw a primary challenge?
- A state where relatively more incumbents face a primary challenge is a more competitive electoral environment than those states with very few (and some with no) primary challenges to incumbents.
- A total of 1,005 incumbents faced a primary challenger in 2016. Because 4,883 incumbents ran for re-election in 2016, that means that only 20.6 percent of them faced a primary challenger. In 2014, 1,009 (20.1%) of incumbents faced a primary opponent.
- The remaining 3,878 incumbents (79.4%) that ran for re-election in 2016 had no primary challenger.
Read more about incumbents with primary opposition here »
Major party candidates with no competition: — Are there two major party candidates in the general election?
- If a Republican or a Democratic candidate doesn't have a Democratic or Republican general election competitor, he or she will win 98 percent or more of the time. A state where there are many legislative candidates without major party competition in the general election is one with a much less competitive electoral environment than states where most or all legislative candidates do have major party competition in the general.
- There was only one major party candidate in 2,477 (41.8%) of the 5,923 seats up for election in 2016.
- There was more than one major party candidate in 3,446 (58.2%) of the 5,923 seats up for election in 2016. In 2014, 3,451 (57.0%) seats had two or more major party candidates.
Read more about general election competition here »
Incumbents defeated
General elections
The number of incumbents defeated in general elections varies depending on the nature of the election. Some years, like 2010, experience what is referred to as a wave election. The 2010 election was one in which Republicans had significant momentum and were able to flip many seats. About 500 incumbents were defeated in that general election. Other years have been more tame. In 2014, just over 250 incumbents were defeated. Republicans had another strong year in 2014 but, due to their existing position of controlling majorities in most state legislatures, the resulting number of defeated incumbents remained low.
In the 2016 general election, 235 incumbents were defeated.
- There were 126 Democratic incumbents defeated in general elections.
- Another 105 Republican incumbents were defeated.
 There were four third party incumbents defeated.
Primary elections
Historically, incumbents who run for re-election rarely lose in the primary. In 2016, 123 incumbents were defeated in primary elections. About 10 percent of incumbents are defeated in an average election cycle, with most of those defeats occurring in the general election.
- There were 39 Democratic incumbents defeated. In other words, 90.4 percent of all Democratic incumbents who faced a primary defeated their challenger.
- Another 84 Republican incumbents were defeated. In other words, 86.1 percent of all GOP incumbents who faced a primary defeated their challenger.
Click here to see more data on incumbents who were defeated in 2016 elections »
Context
Less than 20 percent of voters can identify their state legislator. A 2013 study, authored by Steven Rogers and published in the Annals of the American Academy of Political and Social Science, argues that, in part because of this knowledge gap, voters tend to vote along party lines, driven by their opinion of the current president and the rest of the federal government. From 1916 to 2016, there were only five elections in which the party that gained seats in Congress did not also gain seats in state legislatures.[11][12]
Democrats lost a total of 968 seats from the time President Barack Obama (D) took office in January 2009 until after the 2017 election. Geoffrey Skelley at the University of Virginia Center for Politics notes that the average number of seats lost by the sitting president's party has been 450 since World War II. President Ronald Reagan (R) was the only president to net seats during his two terms, gaining six seats total across all 50 state legislatures.[13]
Historically, the party that wins the presidency typically sees coattails down-ballot. In 2000, Republicans saw gains in state legislative seats, while Democrats saw gains in 2008. Regardless of who won the White House in November 2016, it was unlikely that Democrats would lose many state legislative seats, because many of the seats held by Democrats were in districts that have historically been Democratic strongholds. Donald Trump's (R) win in November likely reinforced Republican gains in state legislators. Those gains were relatively minor, if only because Republicans held a large number of seats in state legislatures going into the election.[12]
Although the pattern described above had been largely consistent in recent presidential elections, it was possible that the 2016 election may not have been affected by presidential preference to the same degree as in others. Because Democrats lost so many seats since Obama took office, there was a higher likelihood for the party to regain some of those seats than there was of losing more seats to the Republicans. This idea is referred to as partisan risk.[14][15]
Click here for more context on the forces affecting party control of state legislatures »
Footnotes
- ↑ Includes Connecticut and Delaware, which have senates controlled by Democrats only through tie-breaking votes.
- ↑ Although the Nebraska State Senate elects its members in nonpartisan elections, members of the chamber generally function along party lines when it comes to voting and caucusing. Please see Nebraska State Senate partisan affiliation for more information.
- ↑ Although the Nebraska State Senate elects its members in nonpartisan elections, members of the chamber generally function along party lines when it comes to voting and caucusing. Please see Nebraska State Senate partisan affiliation for more information.
- ↑ Some races remain uncalled.
- ↑ 5.0 5.1 Third party incumbents and vacancies.
- ↑ A coalition between House Democrats, three Republican representatives, and two independent representatives gave effective control of the chamber to Democrats.
- ↑ Although Nebraska is nonpartisan, a majority of state senators are Republican.
- ↑ Politico, "Why Parties Should Hope They Lose the White House," December 1, 2014
- ↑ Includes Connecticut and Delaware, which have senates controlled by Democrats only through tie-breaking votes.
- ↑ 10.0 10.1 Multi-member district with one Democratic incumbent and one Republican incumbent.
- ↑ Vox.com, "This study shows American federalism is a total joke," accessed September 14, 2016
- ↑ 12.0 12.1 The Annals of the American Academy of Political and Social Science, "National forces in state legislative elections," accessed September 14, 2016
- ↑ Politico, "Why Parties Should Hope They Lose the White House," December 1, 2014
- ↑ Washington Post, "Why Democrats could regain state legislatures in 2016 (and it's not just Trump)," accessed September 29, 2016
- ↑ Real Clear Politics, "Polls: General election, Trump vs. Clinton," accessed September 29, 2016
| |||||||||||
| |||||||||||||||||